AUC Relevance:
Demonstrate that a 32.5% decrease in incremental glucose AUC (iAUC) during a standardized meal tolerance test is both clinically meaningful and clinically relevant.
Response:
Recent continuous glucose monitoring (CGM) publications provide the necessary support. Figure 1A displays daily CGM in the format recommended by the International Consensus Conference convened to standardize the approach to CGM data.¹ Inspection of the plot reveals 3 clear peaks in glucose values corresponding to the day’s meals. The superimposed black rectangle calls out the range of glucose levels, 70 to 180 mg/dL, desired to limit complication risk. The time spent in this range over a 24 hour period is referred to as “time in range” (TIR70-180).¹
In Figure 1B, the superimposed vertical lines demarcate the response to breakfast. This is the meal that corresponds to the Meal Tolerance Test (MTT) employed in the research setting to assess the response to a standard caloric load in terms of both size and composition. This demonstrates a direct tie between MTT results and the subject’s glucose control at that point in time.
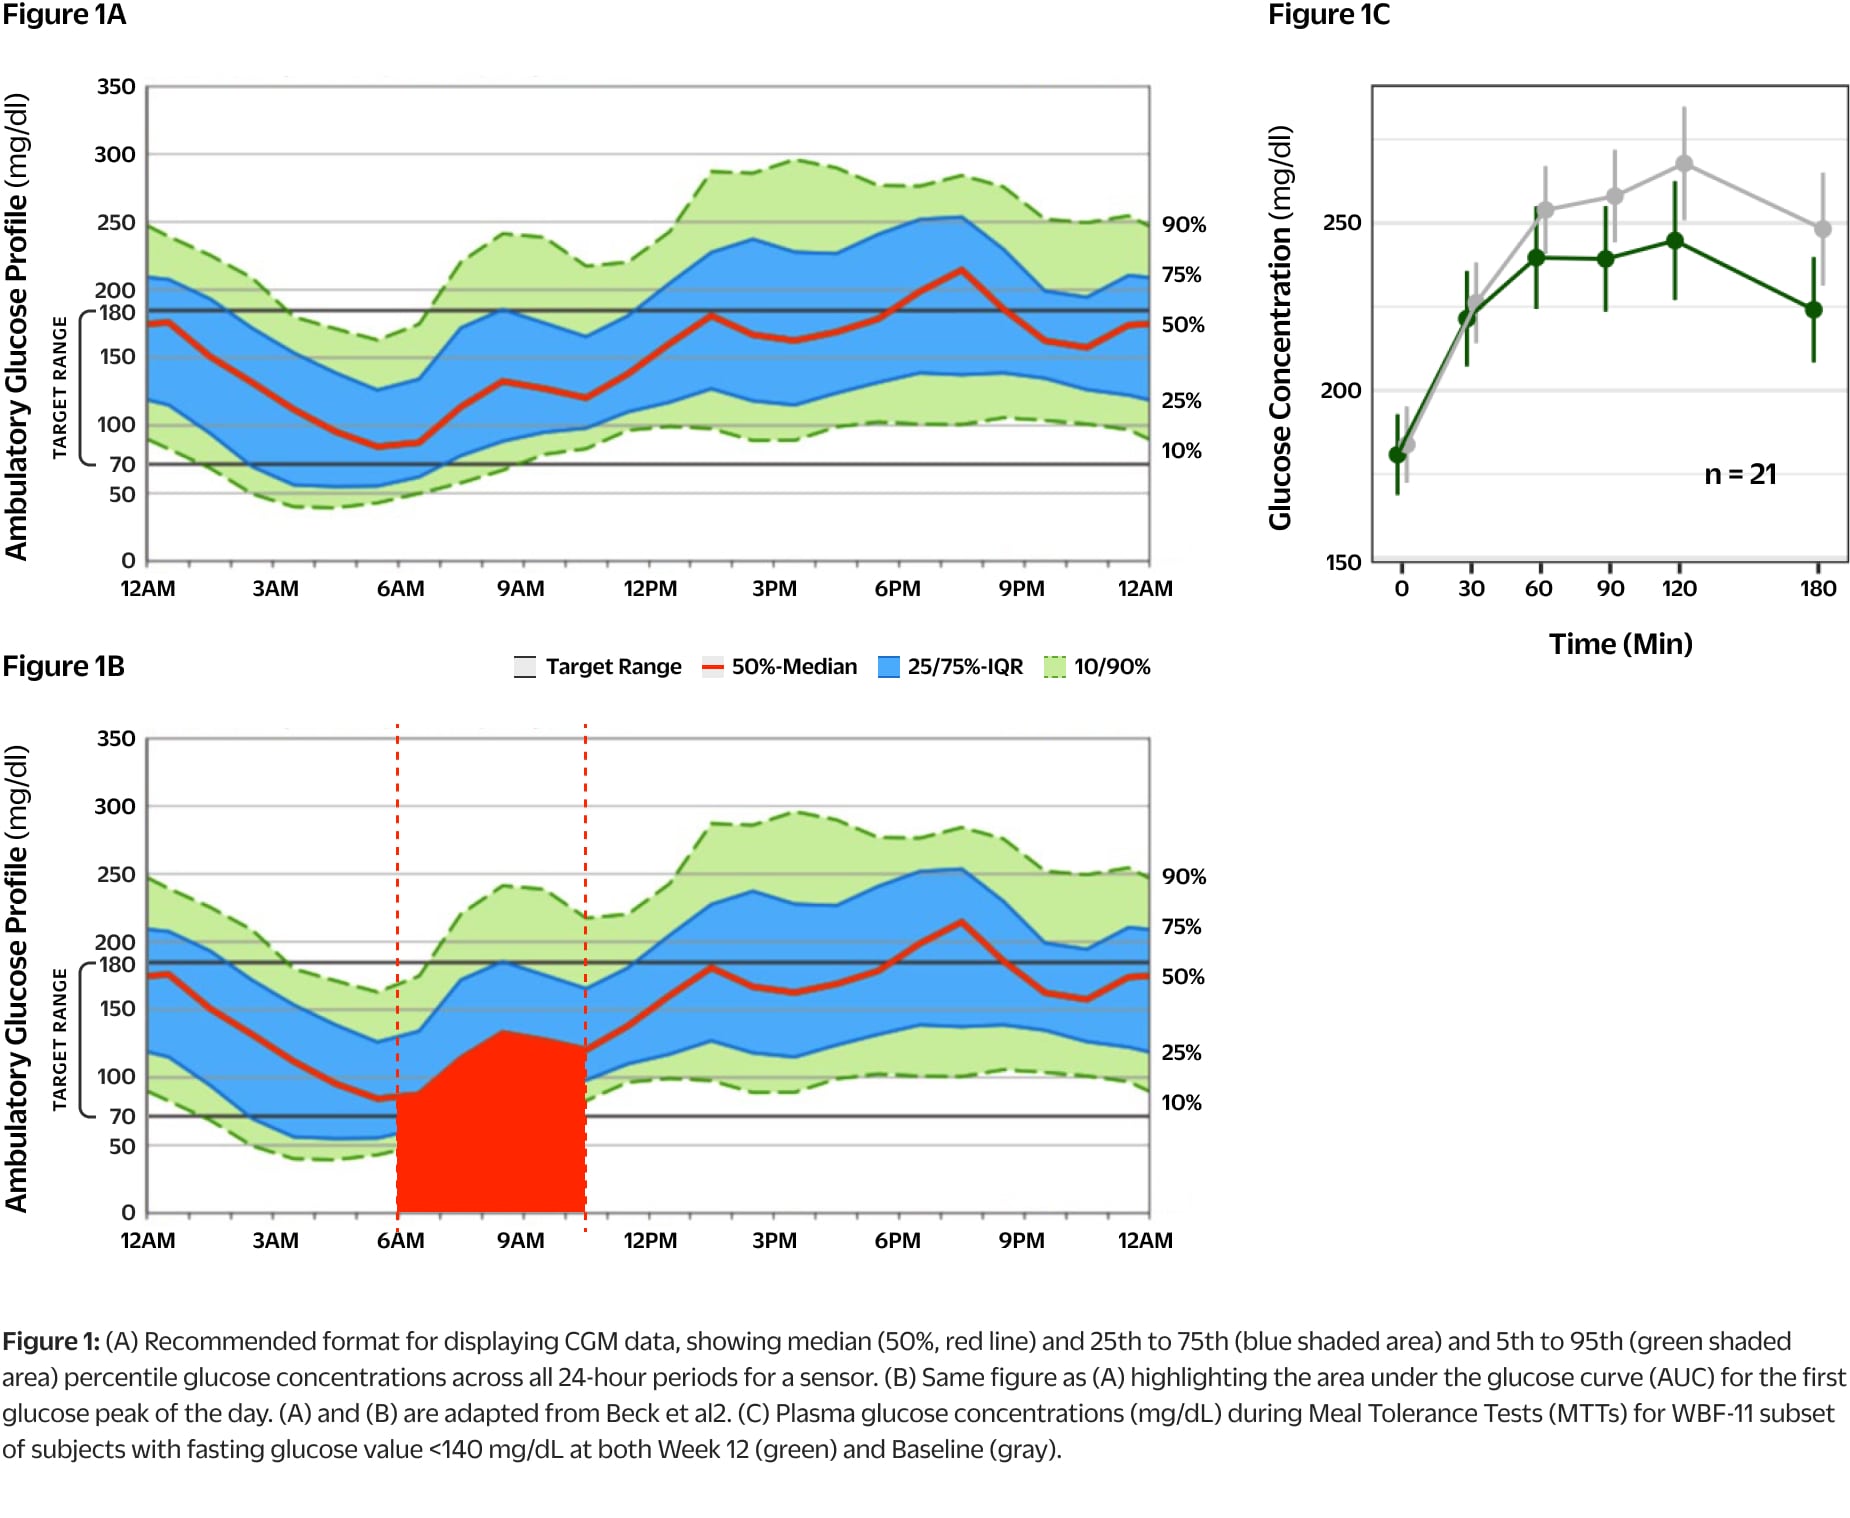
Figure 1C demonstrates the MTT results at baseline and Week 12 for the subset of subjects with fasting glucose values <140 mg/dL. This subset has been analyzed for this discussion as they are the subjects that had glucose values <180 mg/dL at baseline to allow direct assessment of TIR70-180 (See Table 1). Values at baseline are shown in gray while the values at Week 12 are shown in green.
The recently published results from the MOBILE study demonstrated that an increase in TIR70-180 of 19% over a 8-month treatment period resulted in a 1.1% reduction in A1c.³ This is in close agreement with similar values within type 1 diabetes and provides a strong bridge to the relationship between A1c and both microvascular and macrovascular disease previously established in large databases.⁴-⁶ In addition, there are multiple studies published during the past 3 years demonstrating a strong relationship between CGM data collected at a single point in time and the prevalence of long-term complications (2 right hand columns in Table 1).⁷-⁹
The top 3 rows in Table 1 display total glucose AUC (tAUC), iAUC and TIR70-180 data during the MTTs for the WBF-011 subset in Study WB01-202 with values within the 70-180 mg/dL range to allow assessment of TIR70-180 alongside the corresponding prevalence of retinopathy and albuminuria (early stage indicator of diabetic kidney disease) based on the references cited above. These correlations demonstrate clinical relevance.
The reductions in iAUC seen during the MTTs in the WB01-202 study are similar to those observed by customers who collected similar data at home using CGM. In addition, the customer data shows that reductions in iAUC are in reasonable agreement with the increases in TIR70-180. Finally, comparison of the TIR70-180 values in published reports connect the data to the prevalence of complications. This presentation also demonstrates how the standardized MTT test used for research purposes can be related to CGM data. However, these connections are made by connecting datasets from different subject cohorts across studies. Can these relationships be confirmed with the same subject?
We now have real world CGM data from two customers who were using CGM at the time they initiated Pendulum Glucose Control (PGC, same composition as WBF-011) and volunteered to share their CGM data with Pendulum. They shared CGM data collected during Weeks 1 to 2 and Weeks 11 to 12 of their PGC experience during which time they had the same identical meal (caloric and composition comparable to the liquid meal challenge employed in WB01-202) for breakfast on multiple days within each period. This allowed calculation of TIR70-180 across the 24 hours of the day as well as tAUC and iAUC values during the standardized meal tolerance tests. This data is shown in the bottom 6 rows of Table 1 and displays the same agreement between reductions in iAUC and increases in TIR70-180. The anticipated reductions in the prevalence of both retinopathy and albuminuria are in good agreement with the top 3 rows, >26% and > 12% respectively. These reductions in prevalence clearly have clinical relevance.

In Summary:
A range of iAUC values of 33 - 38% would be expected to correspond with reductions in prevalence of retinopathy of 26 - 29% and of albuminuria of 12 - 15%. We would therefore expect that the observed average reduction of 32.5% iAUC observed in the WB01-202 study would correspond to the lower portion of those ranges, but well within bounds of clinical relevance. The addition of this recently published data, clearly connects the reduction in iAUC observed in the WBF-011 subjects in the WB01-202 clinical study to clinically relevant reductions in the prevalence of chronic complications using CGM data. The rapidly expanding use of CGM to acquire real-time, actionable data for use in guiding changes in management regimens to improve glycemic control demonstrates the clinical significance of this information.
References
- Danne T, Nimri R, Battelino T, et al. International consensus on use of continuous glucose monitoring. Diabetes Care 2017;40(12):1631–1640.
- Beck RW, Bergenstal RM, Cheng P, et al. The relationships between time in range, hyperglycemia metrics, and hba1c. J Diabetes Sci Technol 2019;13(4):614–626
- Martens T, Beck RW, Bailey R, et al. Effect of continuous glucose monitoring on glycemic control in patients with type 2 diabetes treated with basal insulin: A randomized clinical trial. JAMA 2021;325(22):2262–2272
- Beck RW, Bergenstal RM, Riddlesworth TD, et al. Validation of time in range as an outcome measure for diabetes clinical trials. Diabetes Care 2019;42(3):400–405.
- Nathan, D. M. et al. The effect of intensive treatment of diabetes on the development and progression of long-term complications in insulin-dependent diabetes mellitus. N. Engl. J. Med. 329, 977–986 (1993).
- UKPDS Study Group. Intensive blood-glucose control with sulphonylureas or insulin compared with conventional treatment and risk of complications in patients with type 2 diabetes (UKPDS 33). Lancet. 1998 Sep; 352(9131) 837-853.
- Lu J, Ma X, Zhou J, et al. Association of time in range, as assessed by continuous glucose monitoring, with diabetic retinopathy in type 2 diabetes. Diabetes Care 2018;41(11):2370–2376.
- Yoo JH, Choi MS, Ahn J, et al. Association Between Continuous Glucose Monitoring-Derived Time in Range, Other Core Metrics, and Albuminuria in Type 2 Diabetes. Diabetes Technol Ther 2020;22(10):768–776.
- Mayeda L, Katz R, Ahmad I, et al. Glucose time in range and peripheral neuropathy in type 2 diabetes mellitus and chronic kidney disease. BMJ Open Diab Res Care 2020;8:e000991. doi:10.1136/bmjdrc-2019-000991